We frequently run sessions with our in-house experts to help you understand the data that Google Analytics is showing. Most people are interested in understanding how their content is performing and we know it can feel a bit daunting if you’re new to it.
Read on for our handy guide which breaks down how to analyse and understand your content in Google Analytics.
If you are new to analytics, to find data about your content, choose “Behavior” and then Site Content from the left hand menu!
Segments

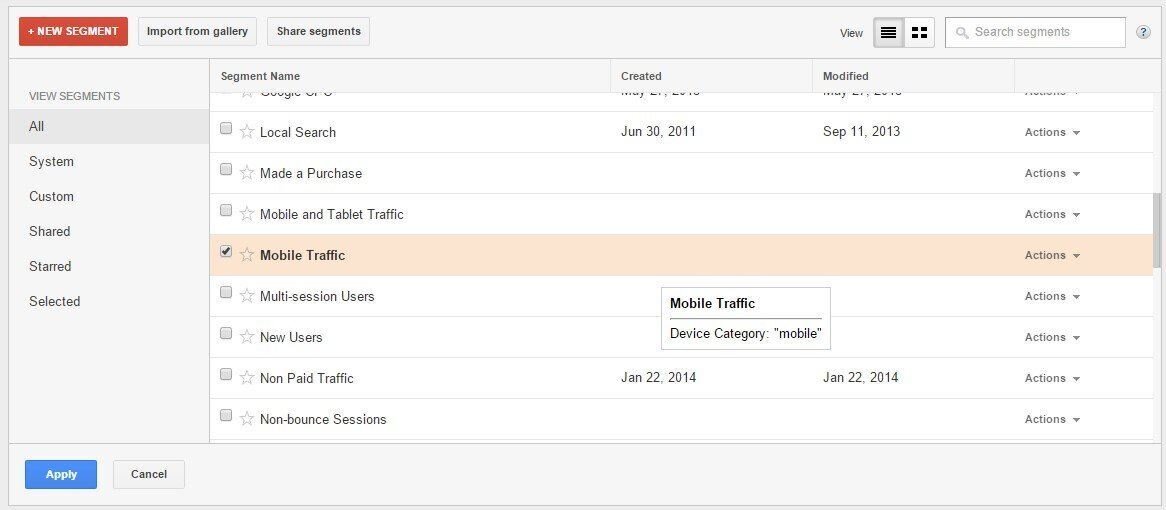
You can segment the data in many different ways to understand how different users are interacting with your content. For example you may be interested in seeing what pages users view when using a mobile device. To quickly do this, select “+Add Segment” which can be found below the data range and select “Mobile Traffic”. You can apply Segments to any report in Google Analytics.
Understanding the key content reports in Google Analytics
Content: All pages

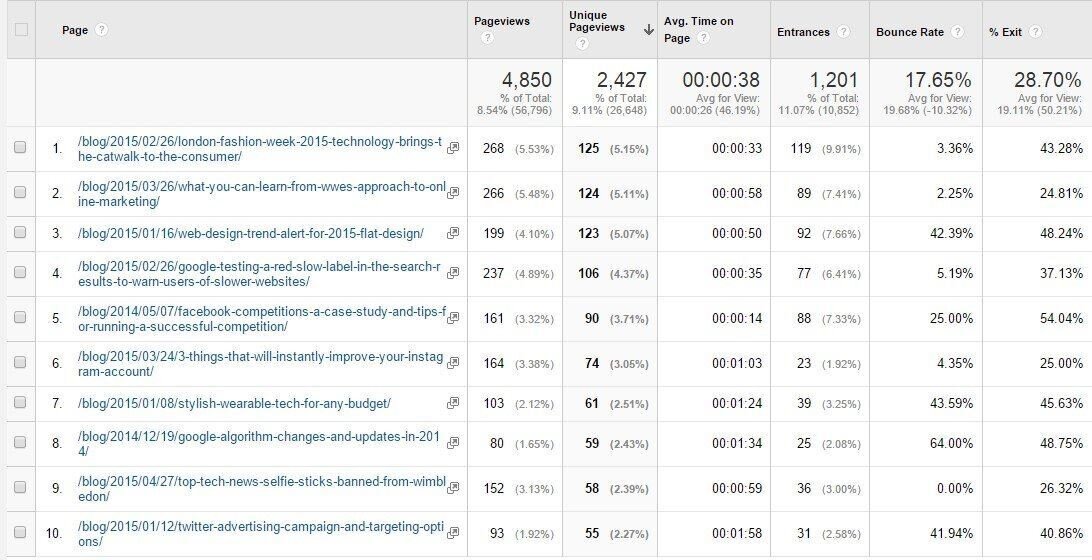
Here you will find a list of all the pages of your site that have been viewed during the date range you have set. If your page URLs don’t make it easy to understand which pages are being viewed, you can select “Page Title” (although it’s worth pointing out that if your pages have the same page title, the data will be combined)
Here’s an overview of the data columns
Pageviews – This will show you which pages on your website are most popular as it is the number of times visitors see the page. If the page is reloaded or returned to, additional pageviews will be recorded.
Unique Pageviews – This refers to the number of individual users who have looked at your pages.
Avg. Time on Page: Uses the time metrics available for the page and works out the average across the pageviews.
Entrances: How many times this page was the first page in a session.
Bounce Rate – This is the percentage of single-page sessions (i.e. sessions in which the person left your site from the page they arrived at without visiting other pages).
% Exit: The percentage of page views that were the final page in a session.
Page Value: Calculated using ecommerce and goal values, this divides the total value by the number of pageviews for this page.
Filtering pages:

If you are only interested in seeing data about specific types of pages (for example your blog posts or pages about your team members), simply select “advanced” to the right hand side of the search box above the data table and specify what pages to include. Typically choosing “Include page containing /blog” and “Exclude page exactly matching /blog” (and any blog archive urls i.e “/blog/2” will show only your blog posts.
Landing page report
A landing page is the page on your website that visitors arrive at. Typically the most popular landing page will be your websites homepage or contact page (for example if somebody searched for your address), however, I’ve seen plenty of occasions where pages that you didn’t expect are more popular.

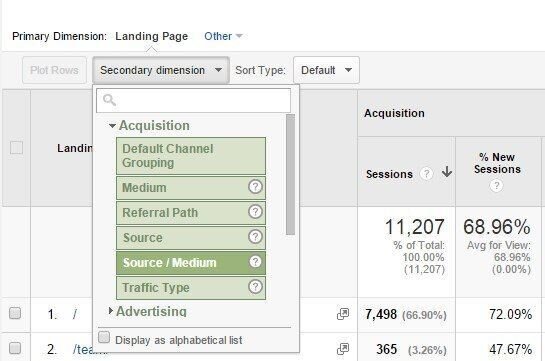
It’s possible to see how users arrived at these pages, choose “Secondary dimension” and select “Source/Medium”.
Behaviour flow

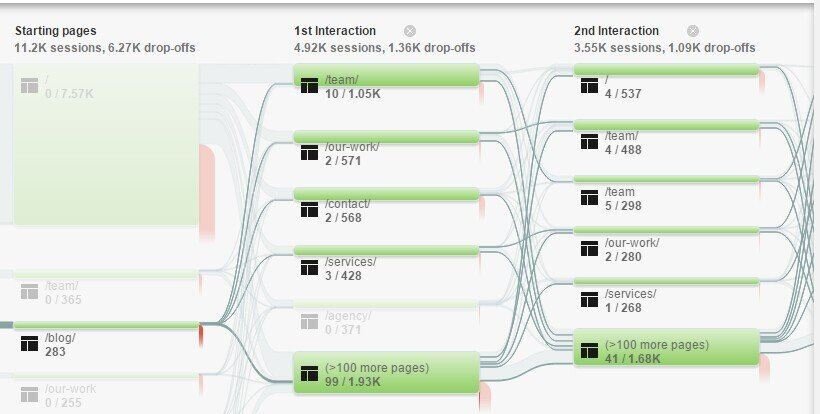
This report gives you a nice visual of your website visitors’ journey on your website, starting from the page they arrive until they leave. This can give you a great understanding of the key “drop off” points on your website and can help you prioritise what pages and areas that you need to improve
If you click on one of the pages in the first column you will have the option to highlight that section of the traffic, making it easier to see the journey that you are most interested in.
Understanding your best performing pages
Engagement
Many of our clients who produce blog content want to see what posts users arrive at (landing page report) and see how engaged with the content they are. For this, I’d recommend that you look at the bounce rate (% of users that leave immediately) and the average time on page.
Another metric of interest is the number of pages per visit, which will indicate if your users are finding your content interesting and reading multiple articles.
Value
If you have eCommerce tracking setup, or you have assigned value to your goals (we recommend that you do this), you can also get an idea of how much that page is worth to you in terms of generating income or leads.
Want to learn more?
If you’d like to book on to one of our Google Analytics for Beginners training courses, you can do so here. Or, if you’d like to speak to one of our digital marketing experts about what we can do for you then please get in touch below, we’d love to hear from you!