The Brief
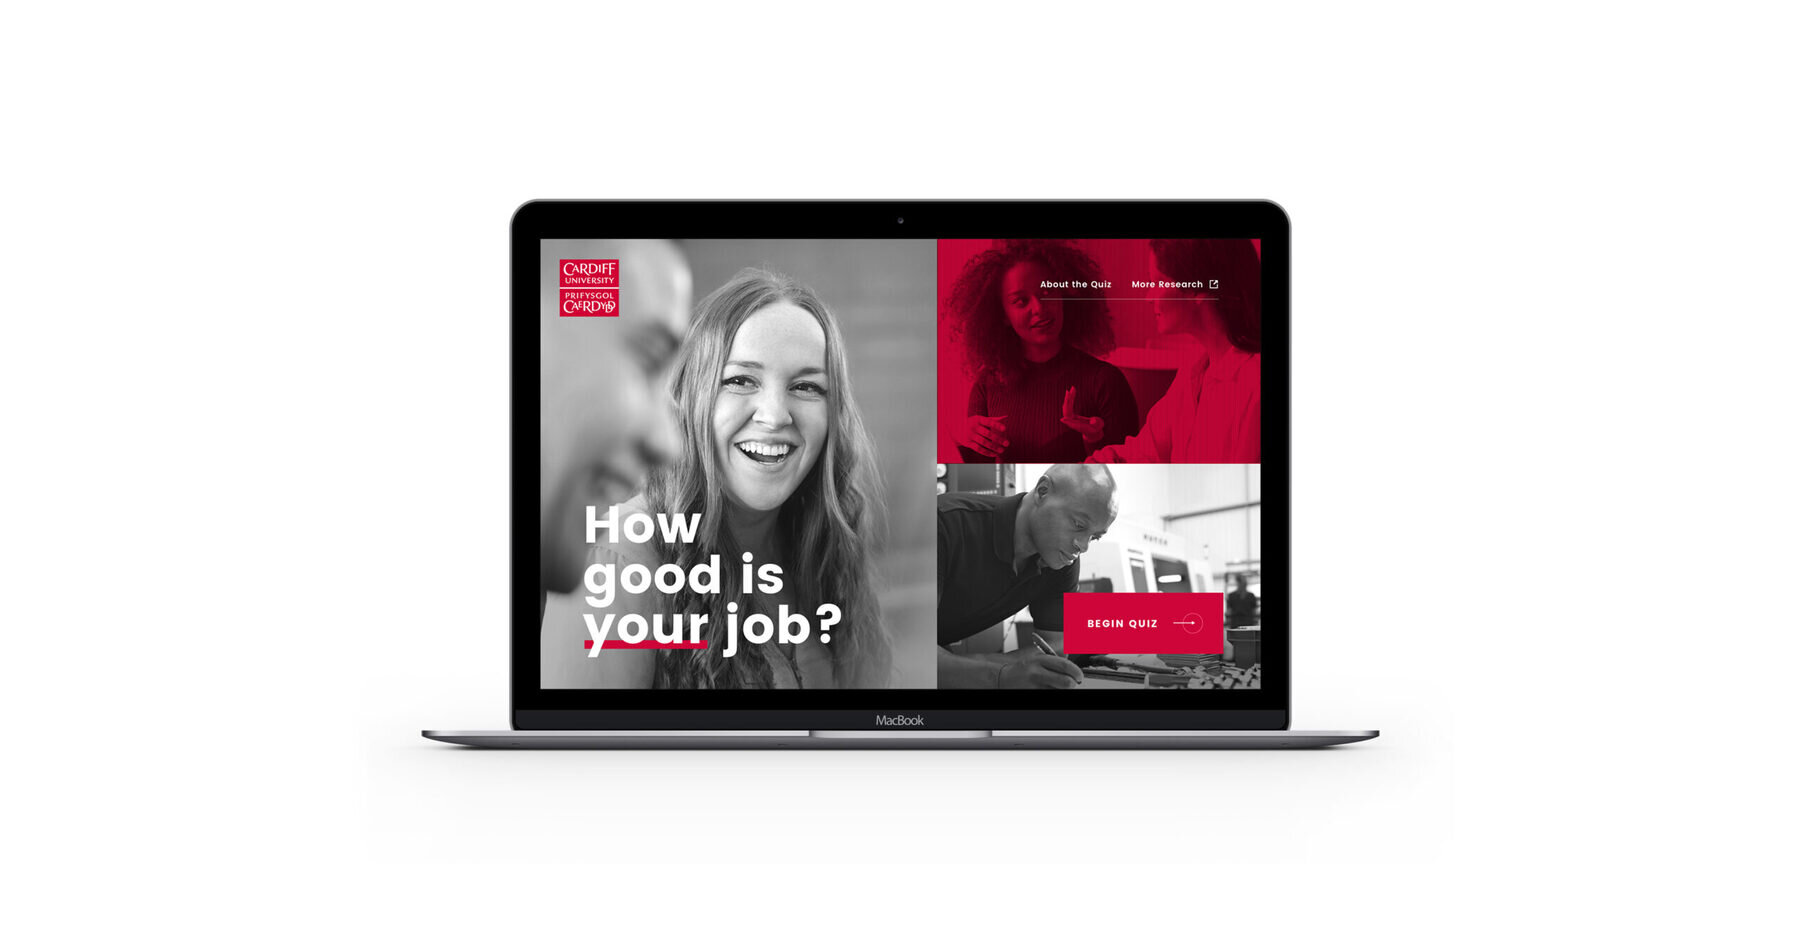
Our task was to design, build and market a website (www.howgoodismyjob.com) that would collect and store survey responses on the quality of working life from people across the United Kingdom. The website would replicate some of the data collected using the previously more time-intensive method of face-to-face interviews. To achieve this, we needed to ensure two things: first that the website provided an intuitive and rewarding user experience and encouraged visitors to complete the quiz. Secondly, through social media campaigns, we needed to drive as much high-quality traffic to the website as possible.
The Solution
To create a quiz which performs without any hitches, the website needed to be built to handle and store large volumes of data effortlessly. At the same time, it needed to be easy and fun to use. Taking a compelling and modern design (nice work design team!), the development team took an unusual route to developing the site to ensure it delivered on its UX-centric brief. To build the website, we used a JavaScript library called React which is exceptional at handling data within browsers, doing a lot of the heavy lifting whilst creating a streamlined experience for the user. It was the perfect solution for the quiz function because the script is robust at managing a lot of data that could change or be manipulated. We were really pleased with the end result!
To make sure the quiz was seen by as many people as possible, we chose Facebook as the main avenue for social advertising. Facebook was our first choice because of its detailed range of targeting options, allowing us to select people with different job titles working in specific industries. We also know from past experience that Facebook audiences love a good quiz!
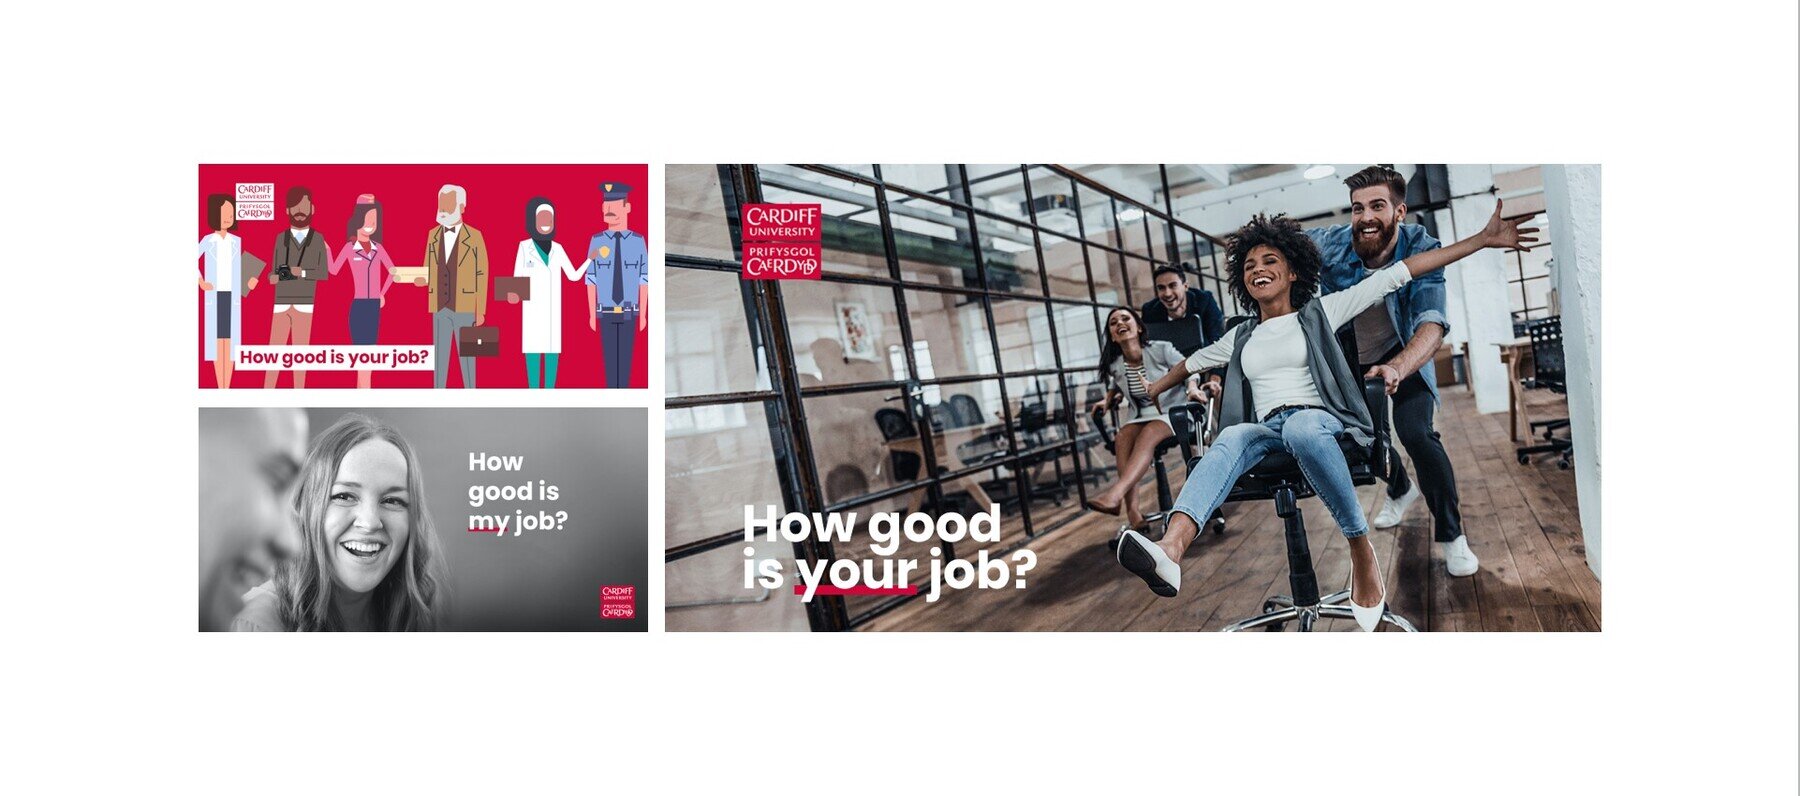
To start with, we needed images for the campaign that would engage our target audience. We ran a split test between three different visual styles (each with different copy) to see which one performed best. We chose photographs of older workers (30-50-year-olds), younger workers (18-25-year-olds) and an illustrated graphic depicting people in different jobs. We felt such a wide range of images would appeal to a variety of different audiences. Interestingly, we found that the illustrated graphic performed far better than either of the photos. As a result, Facebook’s algorithm chose it as the image used to promote the quiz going forward.
During the first phase of the campaign in July, we were amazed by the amount of people who completed the quiz during such a short time period. After just one month, we had over 13,000 submissions. Even more importantly, many people commented and shared their results on Facebook, which was testament to their engagement with the quiz. For the second phase of the campaign in October, we trialled other visual alternatives but the graphic approach was still the clear leader, attracting a large volume of people to respond to the survey. After another month-long campaign, we collected just over 39,400 quiz submissions. The last survey in 2017, which collected data via traditional marketing channels, reached a total of 3,306 submissions. This means our digital marketing efforts have increased the visibility of core parts of the Survey by 1089%.
The Results
- +1089% submissions vs previous offline campaign (3,306 vs 39,400)
- 52,159 Website visits
- 531,726 Social campaigns reach